Sierra Chart Crash Course: Basic Setup Including Footprint & Market Profile
This crash course walks through the complete Sierra Chart setup process from installation to a fully configured order flow trading workspace. It covers everything a new user needs to get started with the platform.
What You’ll Set Up
- Installation and Data Feeds — getting Sierra Chart connected to your broker or data provider
- Chart Settings — configuring basic chart appearance, timeframes, and drawing tools
- Footprint Charts — adding bid/ask volume display with imbalance highlighting
- Market Profile — setting up TPO (Time Price Opportunity) charts for session analysis
- Depth of Market (DOM) — customizing the order ladder for efficient trade execution
- Volume Profile — overlaying session and composite volume profiles on your charts
Why Sierra Chart
Sierra Chart is favored by professional order flow traders for its low latency, extensive customization options, and direct data feed connections. While the learning curve is steeper than some alternatives, the depth of analysis available is unmatched.
Who This Is For
Traders who are new to Sierra Chart and want a step-by-step guide to setting up a professional order flow trading workspace from scratch.
Related Videos
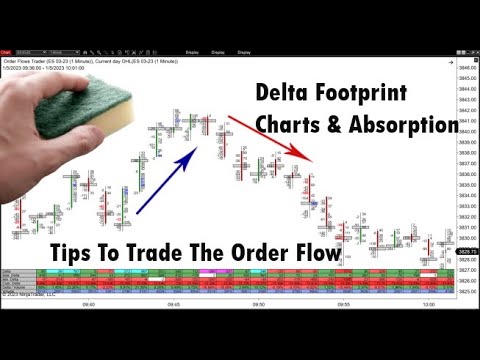
Delta Footprint Charts: Finding Absorption and Aggressive Trading
Learn how to use delta footprint charts to identify absorption zones and aggressive order flow patterns that signal institutional activity.
Watch video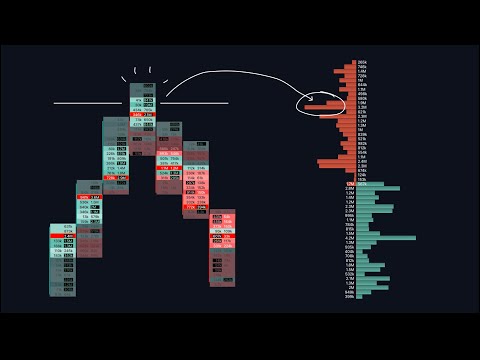
Footprint & Orderflow Charts: A Comprehensive Guide
An in-depth 34-minute walkthrough covering footprint chart basics, heatmaps, tick sizes, volume clusters, delta indicators, and open interest analysis.
Watch video
Master Order Flow Trading in Less Than One Hour
A comprehensive crash course covering Auction Market Theory, market microstructure, footprint charts, cumulative volume delta, and volume profile with practical trading examples.
Watch video
Customizing MotiveWave Order Flow Charts
Official MotiveWave webinar demonstrating how to set up and customize order flow charts including footprint, delta, volume profile, and the order heatmap.
Watch video