Delta Footprint Charts: Finding Absorption and Aggressive Trading
This video from Orderflows dives deep into two critical order flow concepts: absorption and aggressive trading. Understanding these patterns is key to reading institutional activity on the footprint chart.
Absorption vs Aggression
- Absorption — large limit orders sitting at a price level, soaking up incoming market orders without price movement. This often signals a strong support or resistance zone controlled by institutional traders.
- Aggressive Trading — a surge of market orders hitting one side, pushing price through levels. This indicates conviction and urgency from the aggressive side.
What the Video Covers
- How to spot absorption on delta footprint charts
- Identifying aggressive buyers and sellers through volume imbalances
- Reading the delta column to gauge net buying/selling pressure
- Using these patterns to anticipate price direction
- Real chart examples with trade annotations
Why This Matters
Most retail traders only see price and basic volume. By reading the delta footprint, you can see the battle between passive (limit) and aggressive (market) participants — giving you an edge in understanding who is winning the auction.
Related Videos
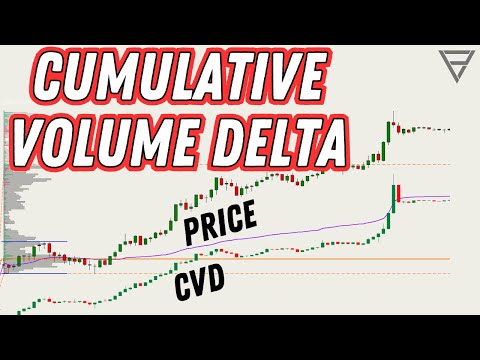
Cumulative Volume Delta - One of the Best Orderflow Trading Tools
Learn how to use Cumulative Volume Delta (CVD) to identify divergences, confirm trends, and spot reversals in your order flow analysis.
Watch video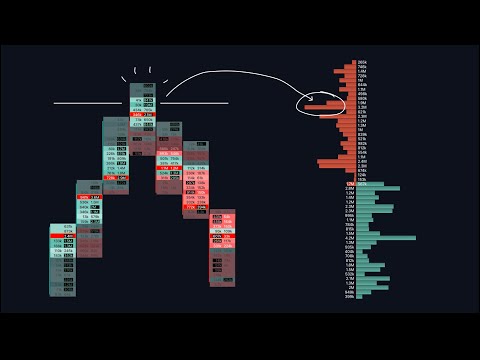
Footprint & Orderflow Charts: A Comprehensive Guide
An in-depth 34-minute walkthrough covering footprint chart basics, heatmaps, tick sizes, volume clusters, delta indicators, and open interest analysis.
Watch video
Master Order Flow Trading in Less Than One Hour
A comprehensive crash course covering Auction Market Theory, market microstructure, footprint charts, cumulative volume delta, and volume profile with practical trading examples.
Watch video
Customizing MotiveWave Order Flow Charts
Official MotiveWave webinar demonstrating how to set up and customize order flow charts including footprint, delta, volume profile, and the order heatmap.
Watch video