Footprint & Orderflow Charts: A Comprehensive Guide
This video provides a thorough breakdown of footprint and orderflow charts, explaining every element you see on the chart and how to interpret it for trading decisions.
Topics Covered
- Footprint Basics — understanding bid/ask volume displayed at each price level
- Heatmaps — visual representation of volume concentration and how to read color intensity
- Tick Sizes and Clusters — configuring the right granularity for your market
- Volume Spikes — identifying unusual activity that signals institutional participation
- Delta Indicators — measuring buying vs selling aggression at each price level
- Max/Min Delta Values — finding extreme imbalances that precede reversals
- Open Interest Analysis — tracking the creation and liquidation of positions
Key Takeaway
Footprint charts give you a microscopic view of the market that candlestick charts simply cannot provide. By understanding bid/ask imbalances and volume distribution, you can make more informed entries and exits.
Related Videos
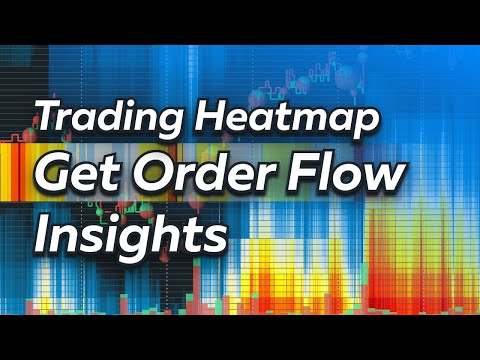
Trading Strategy: How to Read the Heatmap
A focused tutorial on reading Bookmap's heatmap for practical trading setups across futures, stocks, and crypto markets.
Watch video
Bookmap Education Course Part 1: Trading Order Flow & Market Depth
A comprehensive Bookmap course covering DOM trading, market depth visualization, order flow phenomena, and how to read the heatmap for better trading decisions.
Watch video
Bookmap Tutorial: How to Read Order Flow to Find Better Trades
Learn how to use Bookmap's visual order flow tools to identify high-probability trade setups by reading real-time market depth and liquidity patterns.
Watch video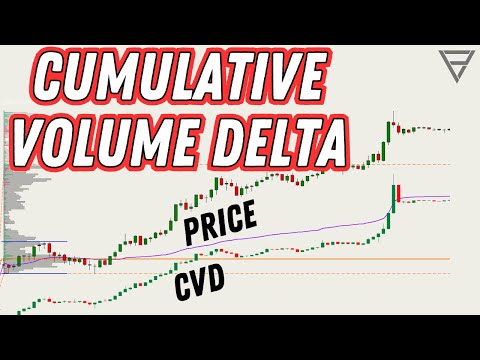
Cumulative Volume Delta - One of the Best Orderflow Trading Tools
Learn how to use Cumulative Volume Delta (CVD) to identify divergences, confirm trends, and spot reversals in your order flow analysis.
Watch video