Cumulative Volume Delta - One of the Best Orderflow Trading Tools
Cumulative Volume Delta is one of the most powerful tools in an order flow trader’s arsenal. This video breaks down exactly how CVD works and how to use it in real trading scenarios.
What is Cumulative Volume Delta?
CVD tracks the running total of buying volume minus selling volume over time. When price is rising but CVD is falling, it signals that the move may be losing steam — a classic divergence setup.
Key Concepts Covered
- Delta Basics — the difference between volume traded at the ask vs the bid
- Cumulative Tracking — how the running total reveals hidden buying/selling pressure
- Divergence Setups — when price and CVD disagree, a reversal may be near
- Trend Confirmation — using CVD to validate the strength of a price move
- Practical Chart Examples — real market scenarios demonstrating each concept
Why CVD Matters
Traditional volume indicators tell you how much was traded, but not who was more aggressive. CVD fills this gap by showing whether buyers or sellers were in control at each moment.
Related Videos

Bookmap Education Course Part 1: Trading Order Flow & Market Depth
A comprehensive Bookmap course covering DOM trading, market depth visualization, order flow phenomena, and how to read the heatmap for better trading decisions.
Watch video
Bookmap Tutorial: How to Read Order Flow to Find Better Trades
Learn how to use Bookmap's visual order flow tools to identify high-probability trade setups by reading real-time market depth and liquidity patterns.
Watch video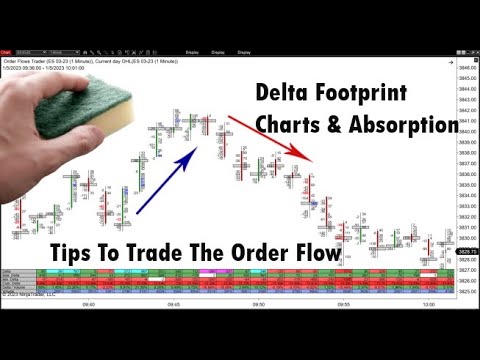
Delta Footprint Charts: Finding Absorption and Aggressive Trading
Learn how to use delta footprint charts to identify absorption zones and aggressive order flow patterns that signal institutional activity.
Watch video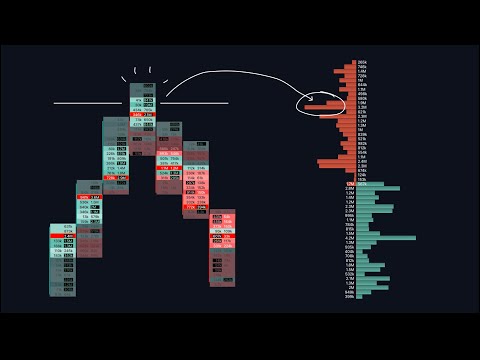
Footprint & Orderflow Charts: A Comprehensive Guide
An in-depth 34-minute walkthrough covering footprint chart basics, heatmaps, tick sizes, volume clusters, delta indicators, and open interest analysis.
Watch video