VolX Masterclass: Read Real-Time Supply & Demand Like Institutions
This Vtrender masterclass introduces the VolX indicator — a tool designed to help traders read real-time supply and demand dynamics the way institutions do.
What is VolX?
VolX is Vtrender’s proprietary indicator that tracks volume flow in real time, helping traders see where buying and selling pressure is concentrated. Unlike simple volume bars, VolX provides context about the quality and direction of volume.
What the Video Covers
- Setting up and reading the VolX indicator
- Identifying supply and demand zones as they form in real time
- Reading institutional intent through volume flow patterns
- Using VolX to confirm order flow signals like IB/IS
- Live examples on Nifty and BankNifty showing VolX in action during different market conditions
Why Read Supply and Demand in Real Time?
Static support and resistance levels are based on historical data. VolX helps you see where supply and demand are actually occurring right now, giving you a dynamic, real-time view of the market’s auction process.
Who This Is For
Traders using Vtrender’s platform who want to add VolX to their analysis toolkit, or anyone interested in understanding how institutional-level supply and demand reading works in practice.
Related Videos

Bookmap Education Course Part 1: Trading Order Flow & Market Depth
A comprehensive Bookmap course covering DOM trading, market depth visualization, order flow phenomena, and how to read the heatmap for better trading decisions.
Watch video
Bookmap Tutorial: How to Read Order Flow to Find Better Trades
Learn how to use Bookmap's visual order flow tools to identify high-probability trade setups by reading real-time market depth and liquidity patterns.
Watch video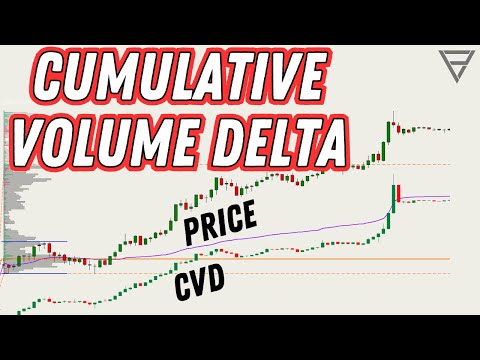
Cumulative Volume Delta - One of the Best Orderflow Trading Tools
Learn how to use Cumulative Volume Delta (CVD) to identify divergences, confirm trends, and spot reversals in your order flow analysis.
Watch video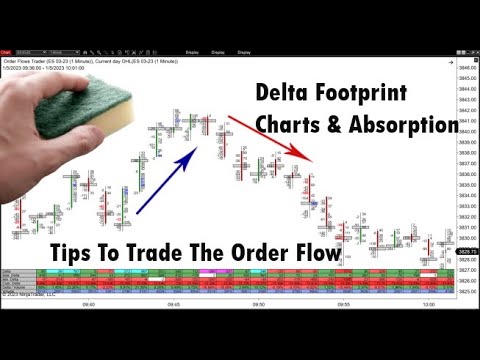
Delta Footprint Charts: Finding Absorption and Aggressive Trading
Learn how to use delta footprint charts to identify absorption zones and aggressive order flow patterns that signal institutional activity.
Watch video