Sierra Chart: In-Depth Footprint Settings
This video dives deep into Sierra Chart’s footprint chart settings, covering every configuration option available. If you already have the basics set up and want to fine-tune your footprint display, this is the video for you.
Settings Covered
- Bid/Ask Column Configuration — choosing how volume is displayed at each price level
- Imbalance Detection — setting thresholds for highlighting significant bid/ask imbalances
- Delta Display Options — configuring how net buying/selling pressure is shown
- Color Schemes — creating custom color maps that highlight the most important information
- Cell Size and Layout — optimizing the visual density for your screen and trading style
- Aggregation Settings — choosing the right tick size and time period for your market
Advanced Features
The video also covers some of Sierra Chart’s unique footprint features that go beyond what most platforms offer, including customizable imbalance ratios and multi-timeframe footprint analysis.
Related Videos

Bookmap Education Course Part 1: Trading Order Flow & Market Depth
A comprehensive Bookmap course covering DOM trading, market depth visualization, order flow phenomena, and how to read the heatmap for better trading decisions.
Watch video
Bookmap Tutorial: How to Read Order Flow to Find Better Trades
Learn how to use Bookmap's visual order flow tools to identify high-probability trade setups by reading real-time market depth and liquidity patterns.
Watch video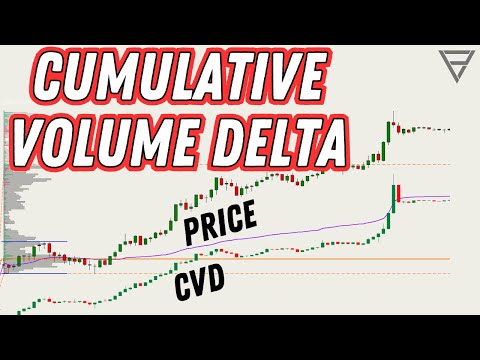
Cumulative Volume Delta - One of the Best Orderflow Trading Tools
Learn how to use Cumulative Volume Delta (CVD) to identify divergences, confirm trends, and spot reversals in your order flow analysis.
Watch video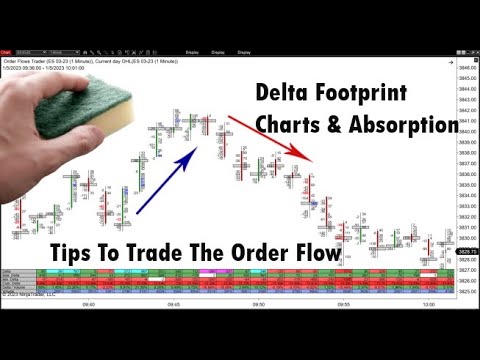
Delta Footprint Charts: Finding Absorption and Aggressive Trading
Learn how to use delta footprint charts to identify absorption zones and aggressive order flow patterns that signal institutional activity.
Watch video