How to Read Order Flow Footprint Charts on NinjaTrader 8
This video focuses on teaching you how to read the raw numbers on a footprint chart within NinjaTrader 8. Many traders are confused by what the bid and ask columns actually represent, and this video clears that up.
Core Concepts
- Bid vs Ask Volume — what the numbers on each side of the footprint actually mean
- Executed Trades vs Pending Orders — a critical distinction that many beginners miss
- Market Orders vs Limit Orders — understanding who is driving price and who is providing liquidity
- Imbalance Reading — identifying when one side is significantly more aggressive
Common Mistakes
The video addresses common misconceptions about footprint chart data, including the difference between volume at the bid (selling aggression) and volume at the ask (buying aggression), and why this distinction matters for your trading decisions.
NinjaTrader 8 Specific
The walkthrough uses NinjaTrader 8’s Orderflows Trader plugin, showing the exact setup and configuration needed to get started with footprint chart analysis on this platform.
Related Videos

Bookmap Education Course Part 1: Trading Order Flow & Market Depth
A comprehensive Bookmap course covering DOM trading, market depth visualization, order flow phenomena, and how to read the heatmap for better trading decisions.
Watch video
Bookmap Tutorial: How to Read Order Flow to Find Better Trades
Learn how to use Bookmap's visual order flow tools to identify high-probability trade setups by reading real-time market depth and liquidity patterns.
Watch video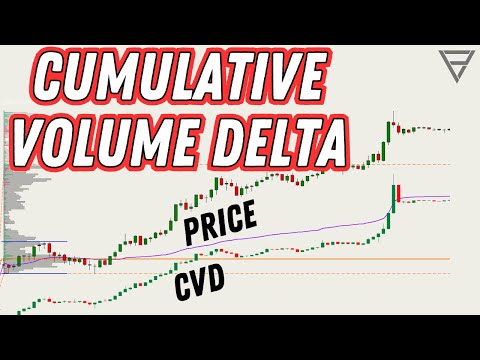
Cumulative Volume Delta - One of the Best Orderflow Trading Tools
Learn how to use Cumulative Volume Delta (CVD) to identify divergences, confirm trends, and spot reversals in your order flow analysis.
Watch video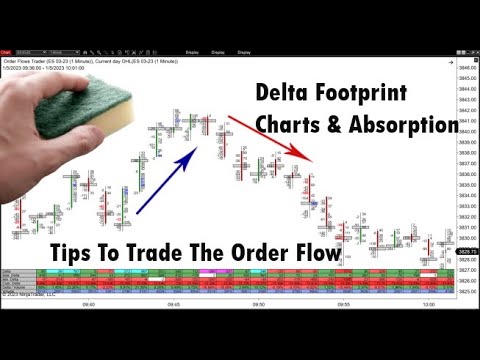
Delta Footprint Charts: Finding Absorption and Aggressive Trading
Learn how to use delta footprint charts to identify absorption zones and aggressive order flow patterns that signal institutional activity.
Watch video