Trading Strategy: How to Read the Heatmap
This video focuses specifically on the heatmap — Bookmap’s signature visualization tool. Rather than covering all features, it zeroes in on how to interpret the heatmap for actionable trading setups.
What the Heatmap Shows
The heatmap displays the limit order book over time as a color-coded visualization. Brighter colors indicate more resting limit orders at that price level, while darker areas show thin liquidity.
Trading Setups Covered
- Liquidity Walls — large concentrations of limit orders that often act as support/resistance
- Fading Liquidity — orders being pulled before price arrives, signaling a potential trap
- Absorption at Key Levels — price hitting a wall and repeatedly failing to break through
- Breakout Confirmation — when liquidity thins out ahead of a level, signaling a likely break
Markets Demonstrated
The video includes examples from futures, equities, and cryptocurrency markets, showing that these heatmap patterns are universal across asset classes.
Related Videos

Bookmap Education Course Part 1: Trading Order Flow & Market Depth
A comprehensive Bookmap course covering DOM trading, market depth visualization, order flow phenomena, and how to read the heatmap for better trading decisions.
Watch video
Bookmap Tutorial: How to Read Order Flow to Find Better Trades
Learn how to use Bookmap's visual order flow tools to identify high-probability trade setups by reading real-time market depth and liquidity patterns.
Watch video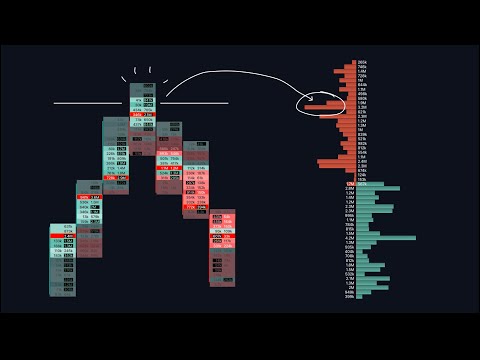
Footprint & Orderflow Charts: A Comprehensive Guide
An in-depth 34-minute walkthrough covering footprint chart basics, heatmaps, tick sizes, volume clusters, delta indicators, and open interest analysis.
Watch video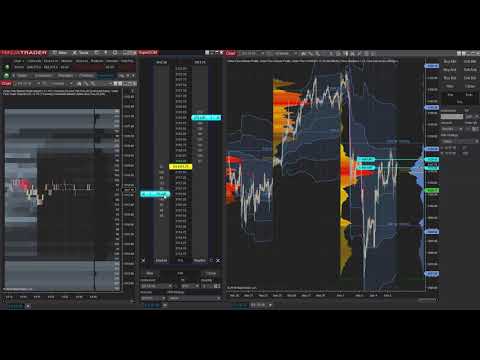
Track Volume Profile with NinjaTrader's Order Flow Day Trading Tools
A comprehensive webinar covering order flow concepts, volumetric bars, volume profile indicators, and the Market Depth Map in NinjaTrader.
Watch video